
#5: Reading 2D Spectographs Part II
- Mar 27, 2017
- 2 min read
In my previous blog post, I described the first few steps of reading 2D spectrographs. This blog post picks up where I left off, and describes how I use information from emission lines to determine a galaxy's dark matter content.

In the image above, we previously identified these two pairs of dots as O2 emission lines. Emission lines always maintain consistent patterns - in other words, these two O2 emission lines will always maintain the same distance between them, as will other pairings of emission lines. We can measure the distance between two dots using the coordinates of the image. Zooming into the previous image . . .
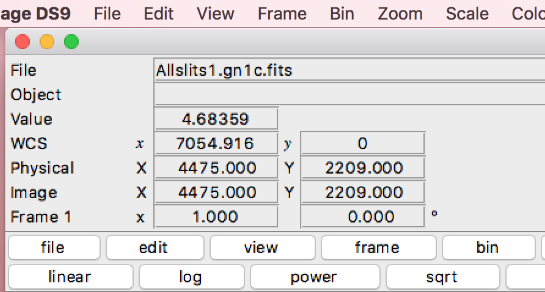
The given coordinates (see the "Physical" tab) allow us to measure the distance between emission lines. We use these values to determine several important values: a galaxy's rotational velocity, redshift, and distance from the Earth.
Rotational Velocity
Each of these emission lines are not actually lines; in fact, they look more like blobs. If you look carefully, you'll notice that the WCS values at the left and right ends of the blob are different. The WCS value corresponds to wavelength. The wavelengths measured at the left and right side of the blob represent the wavelengths measured at the left and right side of the galaxy, respectively. Why are these wavelength values different?
This question ties in to the assumption I am currently getting rid of using my senior project. When first looking at these measurements, I assumed that every galaxy I was looking at was in the exact same position (see below).

Since the galaxy is rotating, one side of the galaxy is coming towards us while the other side moves away from us. The side that moves away is redshifted - the wavelength value is higher than usual - while the side that moves towards us is blueshifted - the wavelength value is lower than usual. (When looking at the data, it is important to notice that overall all the wavelength values will be higher than the rest wavelength because the entire galaxy itself is moving away.)
Using a galaxy's blueshift and redshift, we can then calculate the galaxy's rotational velocity. We can think about this relationship intuitively; if we know the details of how much of a rotating object is coming towards us and how much of it is turning away from us, then we can figure out how quickly the object is spinning. Below is the equation for rotational velocity given a galaxy's blueshift and redshift:
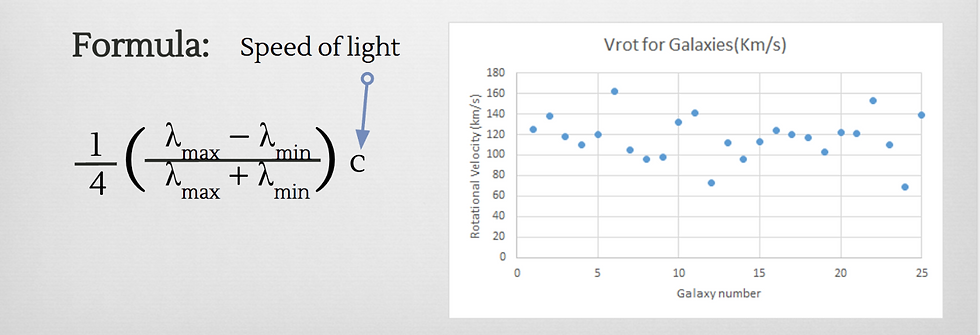
To the right, you can also see a plot of all the rotational velocities I calculated at COSMOS. The average rotational velocity of the galaxies I analyzed was 110 km/s.
In my next blog post I will describe how redshift and the galaxy's distance from the Earth are calculated using 2D spectra as well. I'll also describe more logistical updates to my project, and how the goal of my project may evolve with time given the nature of my research. Feel free to leave any comments or questions below. Until Thursday, dear reader, and as always thank you for your interest in my work.


Comments